This dashboard visualizes trends in U.S. honey production from 1998 to 2012. The plots focus on geographic production patterns, national production change, state-level declines, price relationships, and the importance of top-producing states.
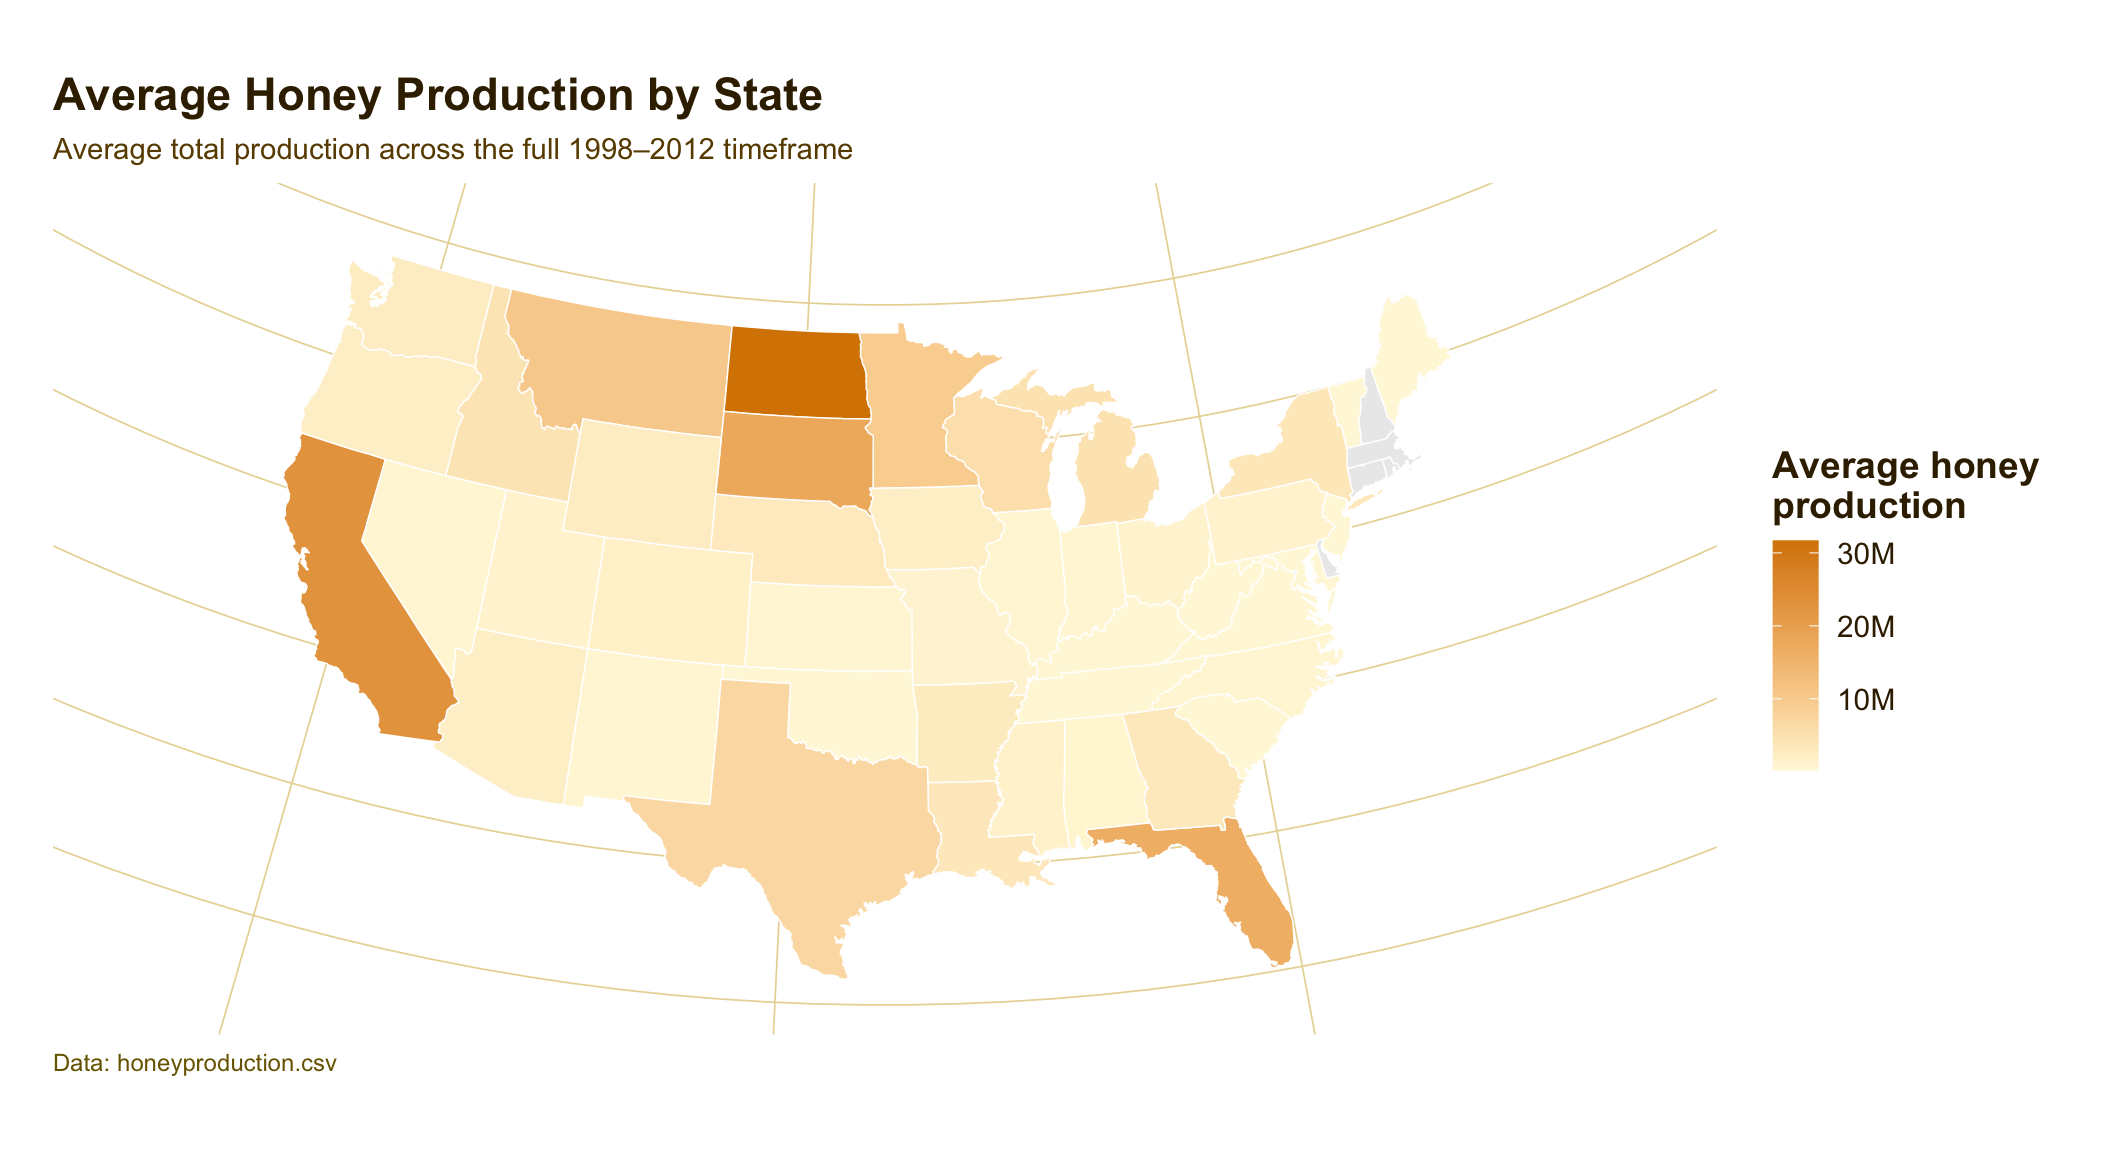
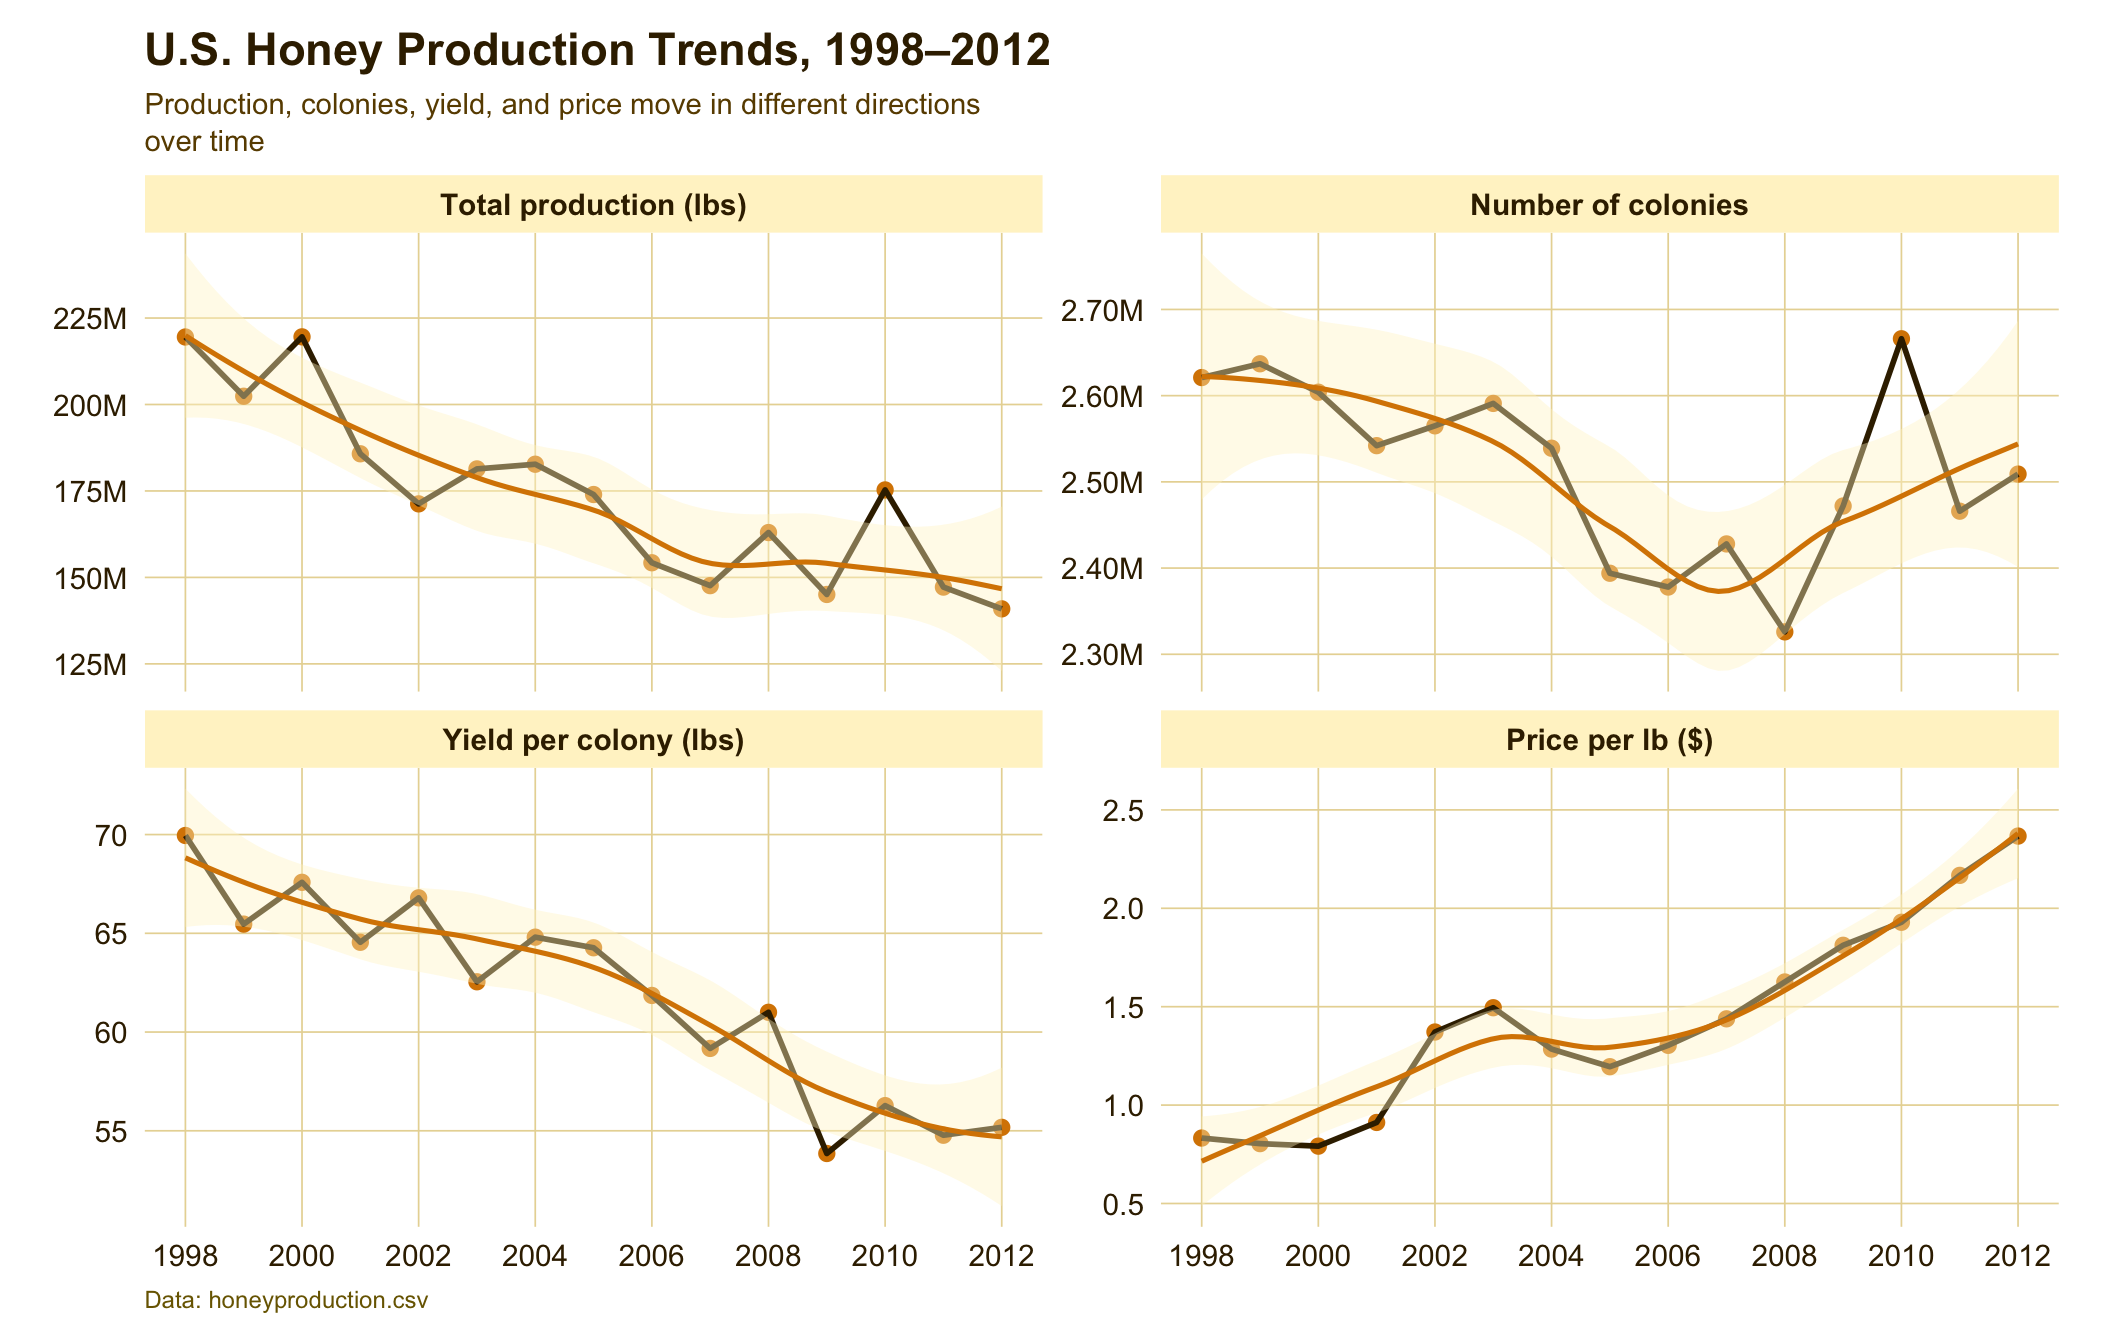
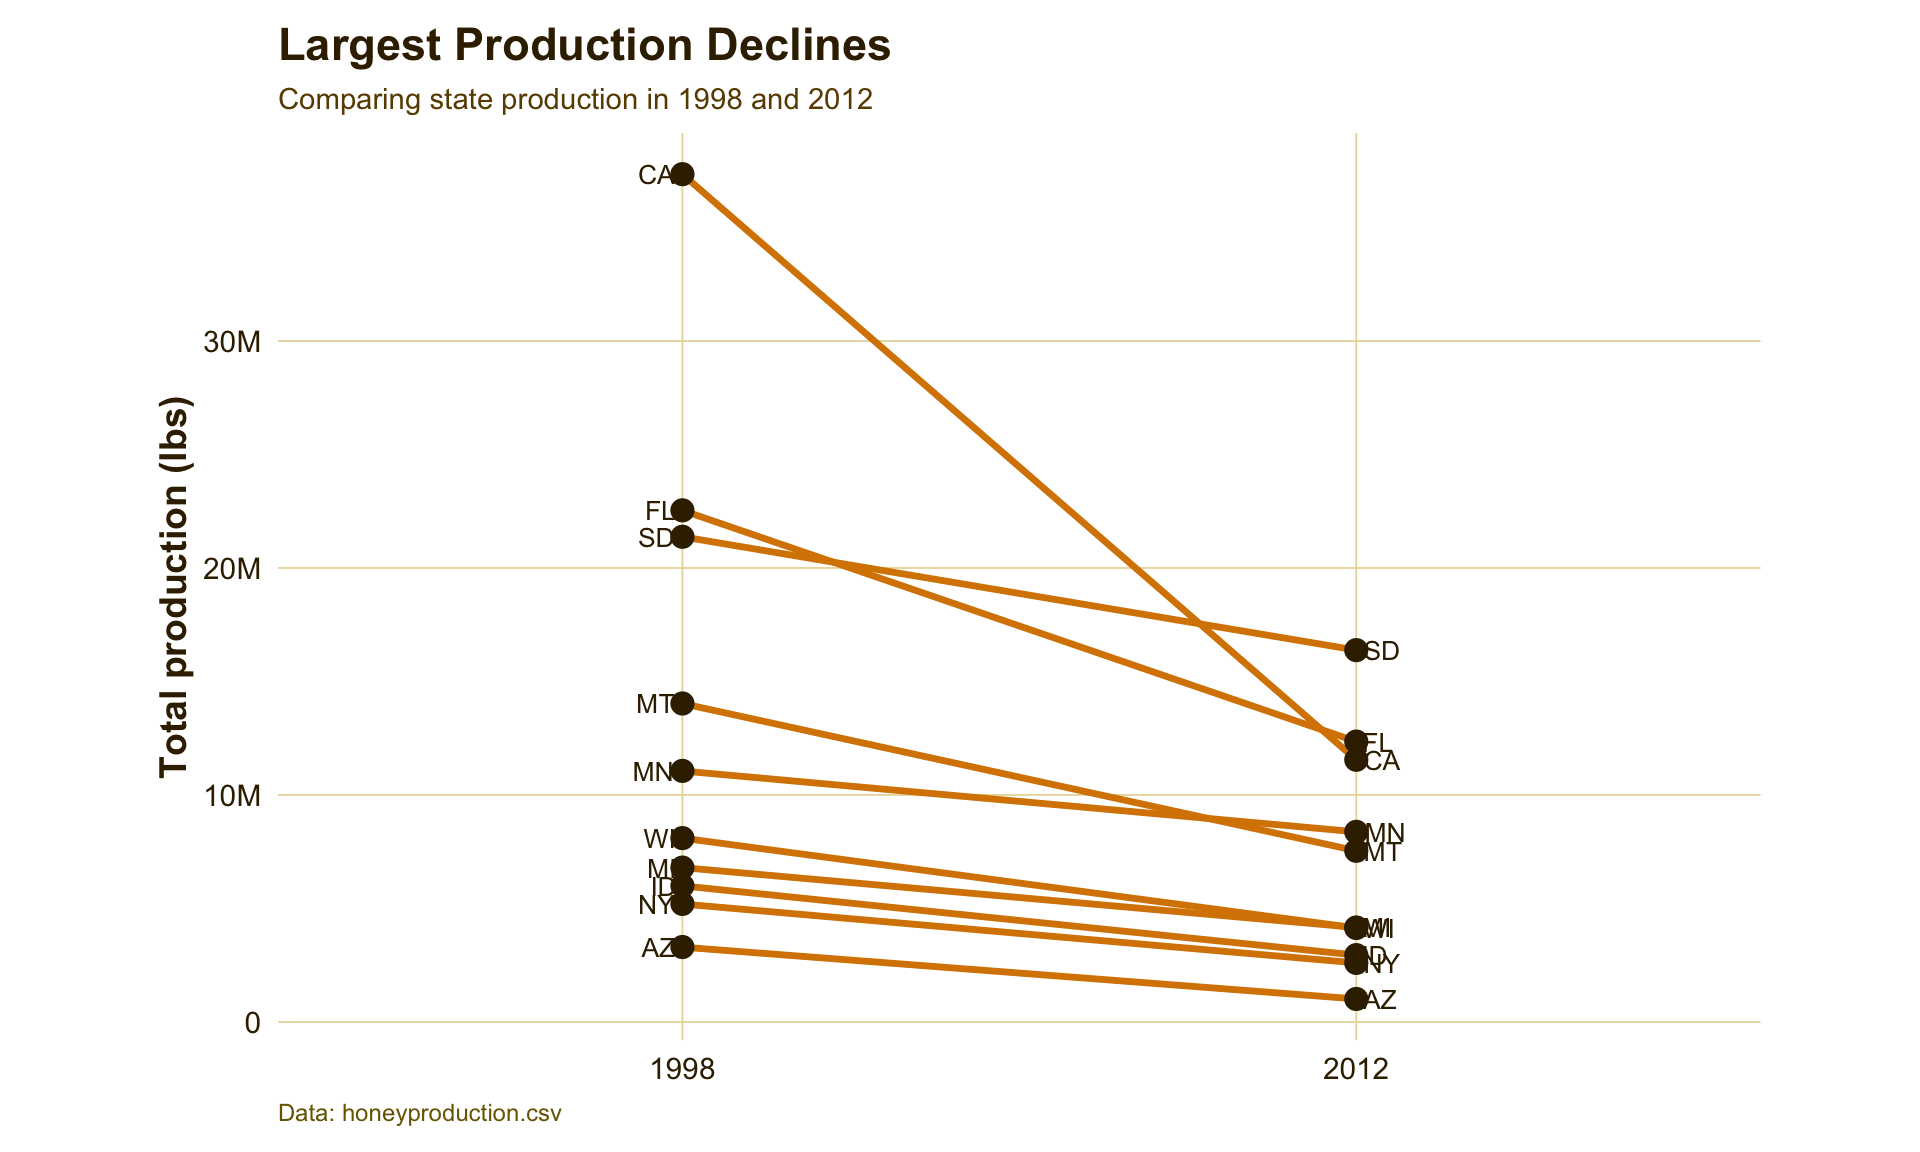
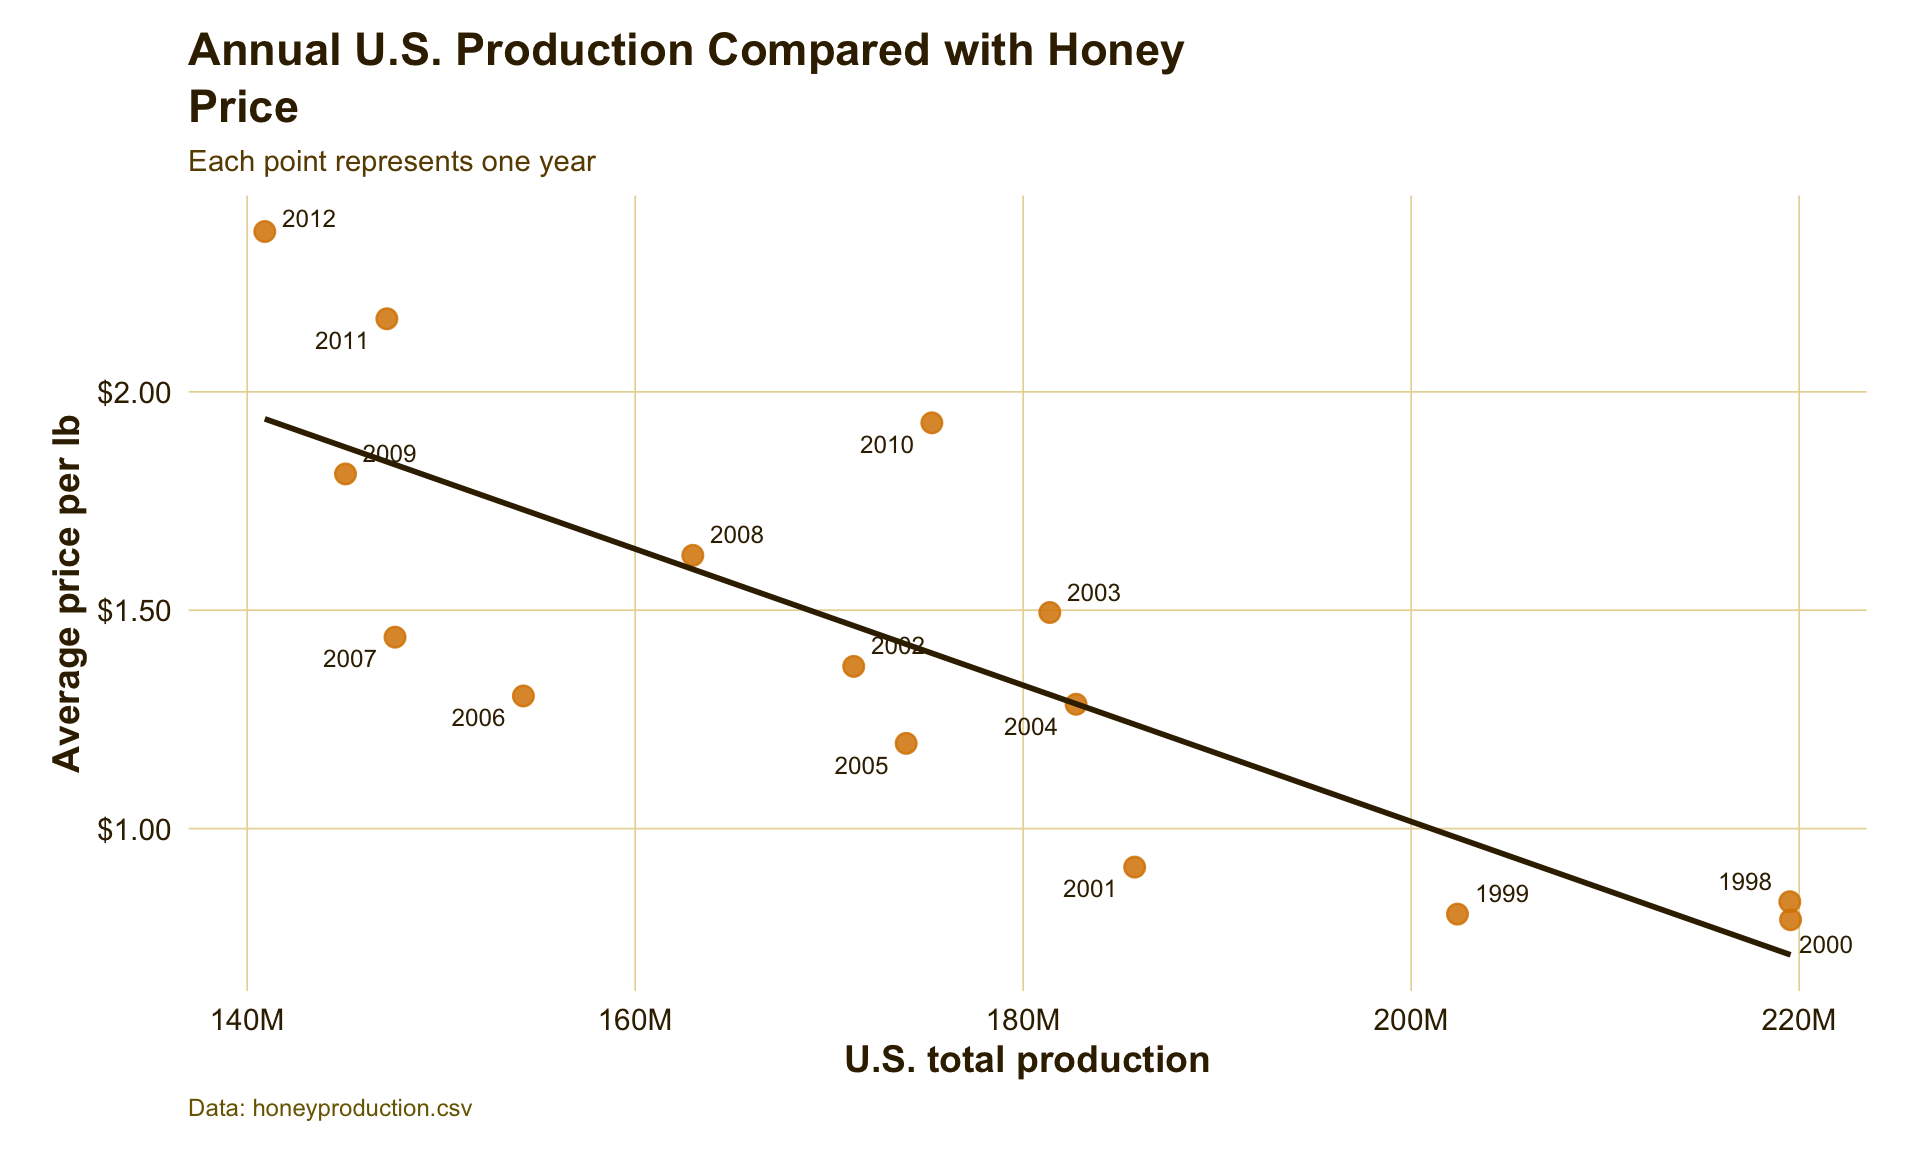
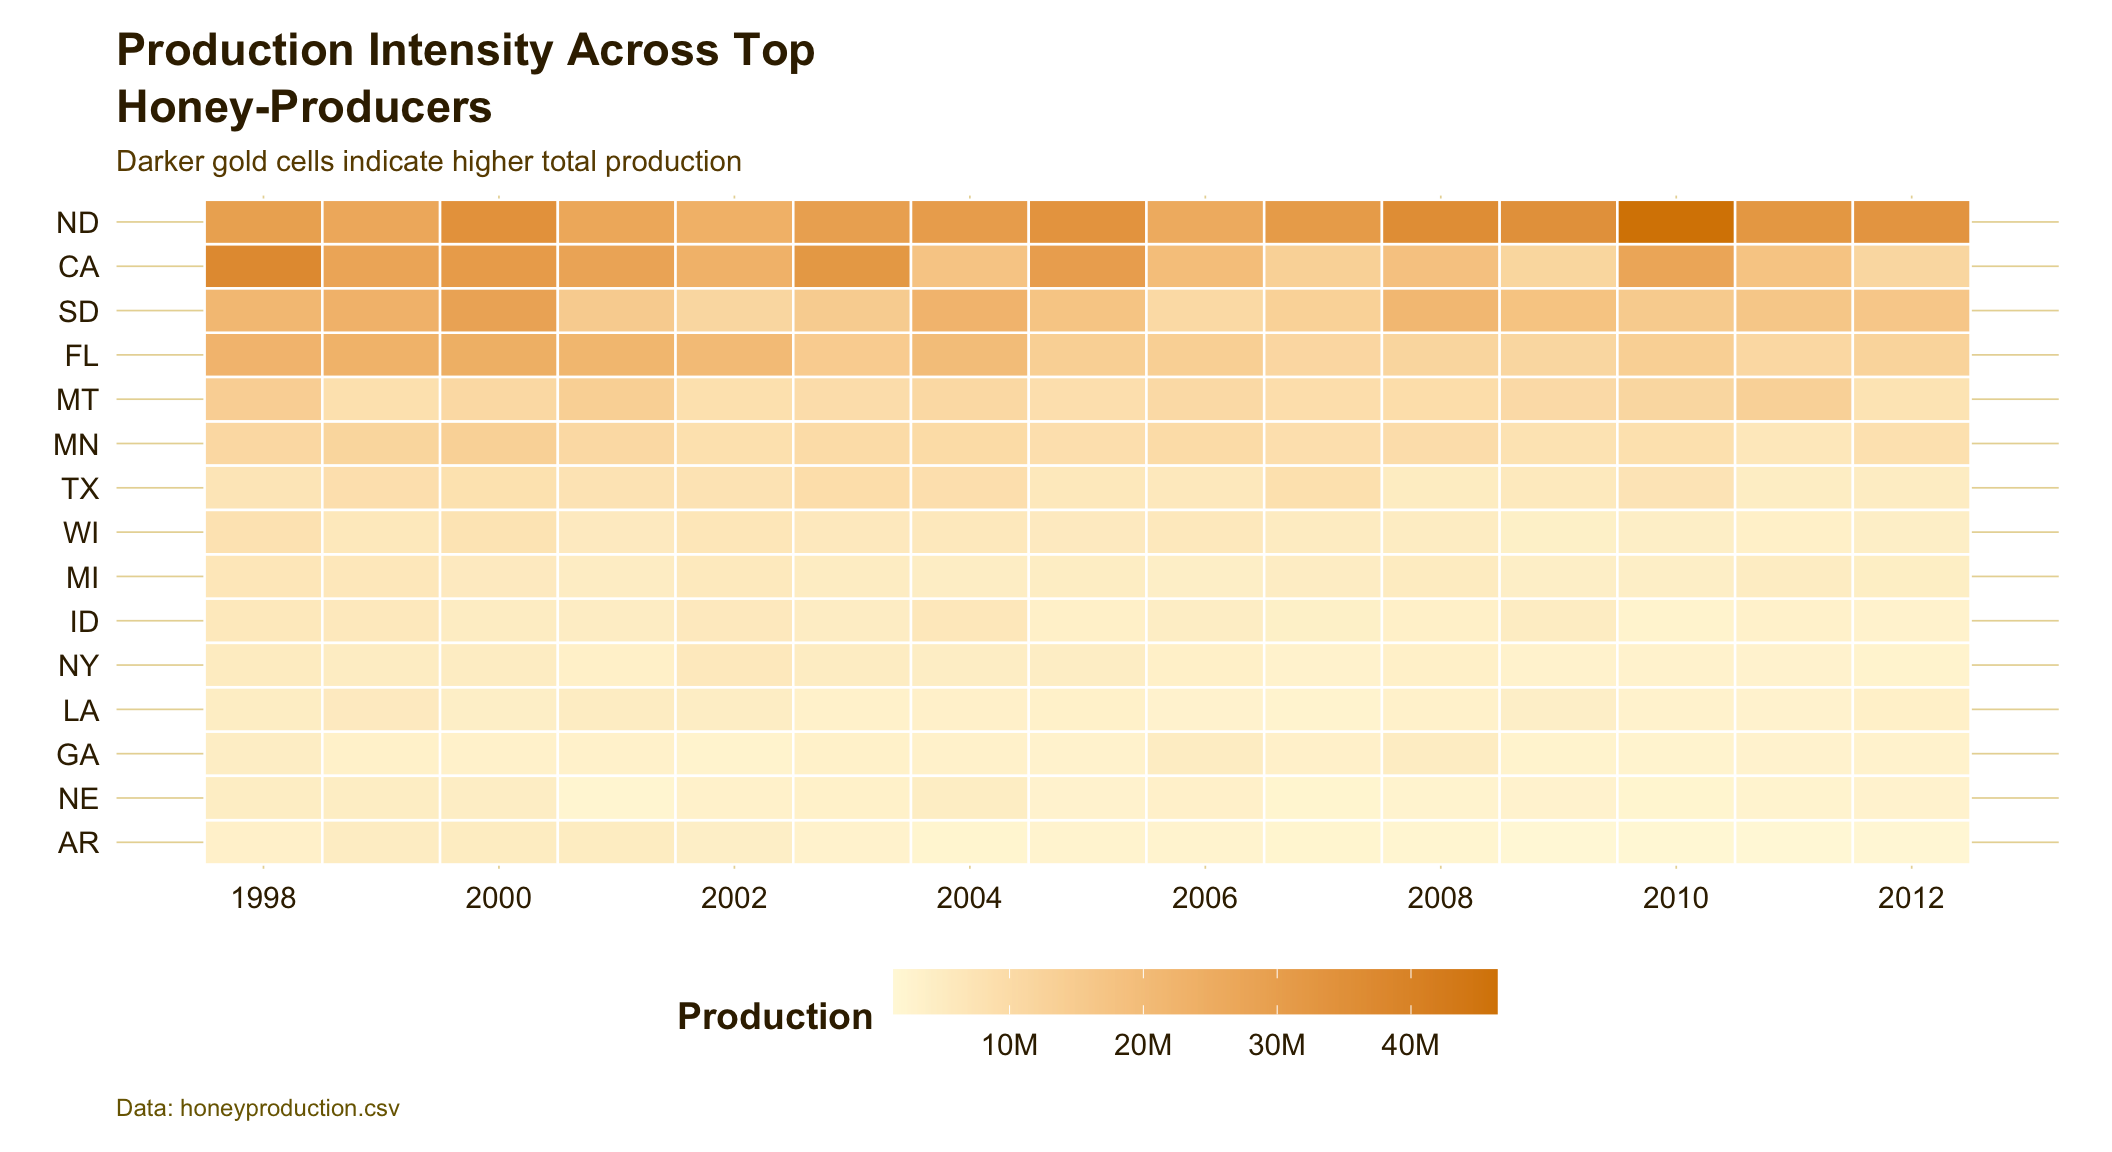
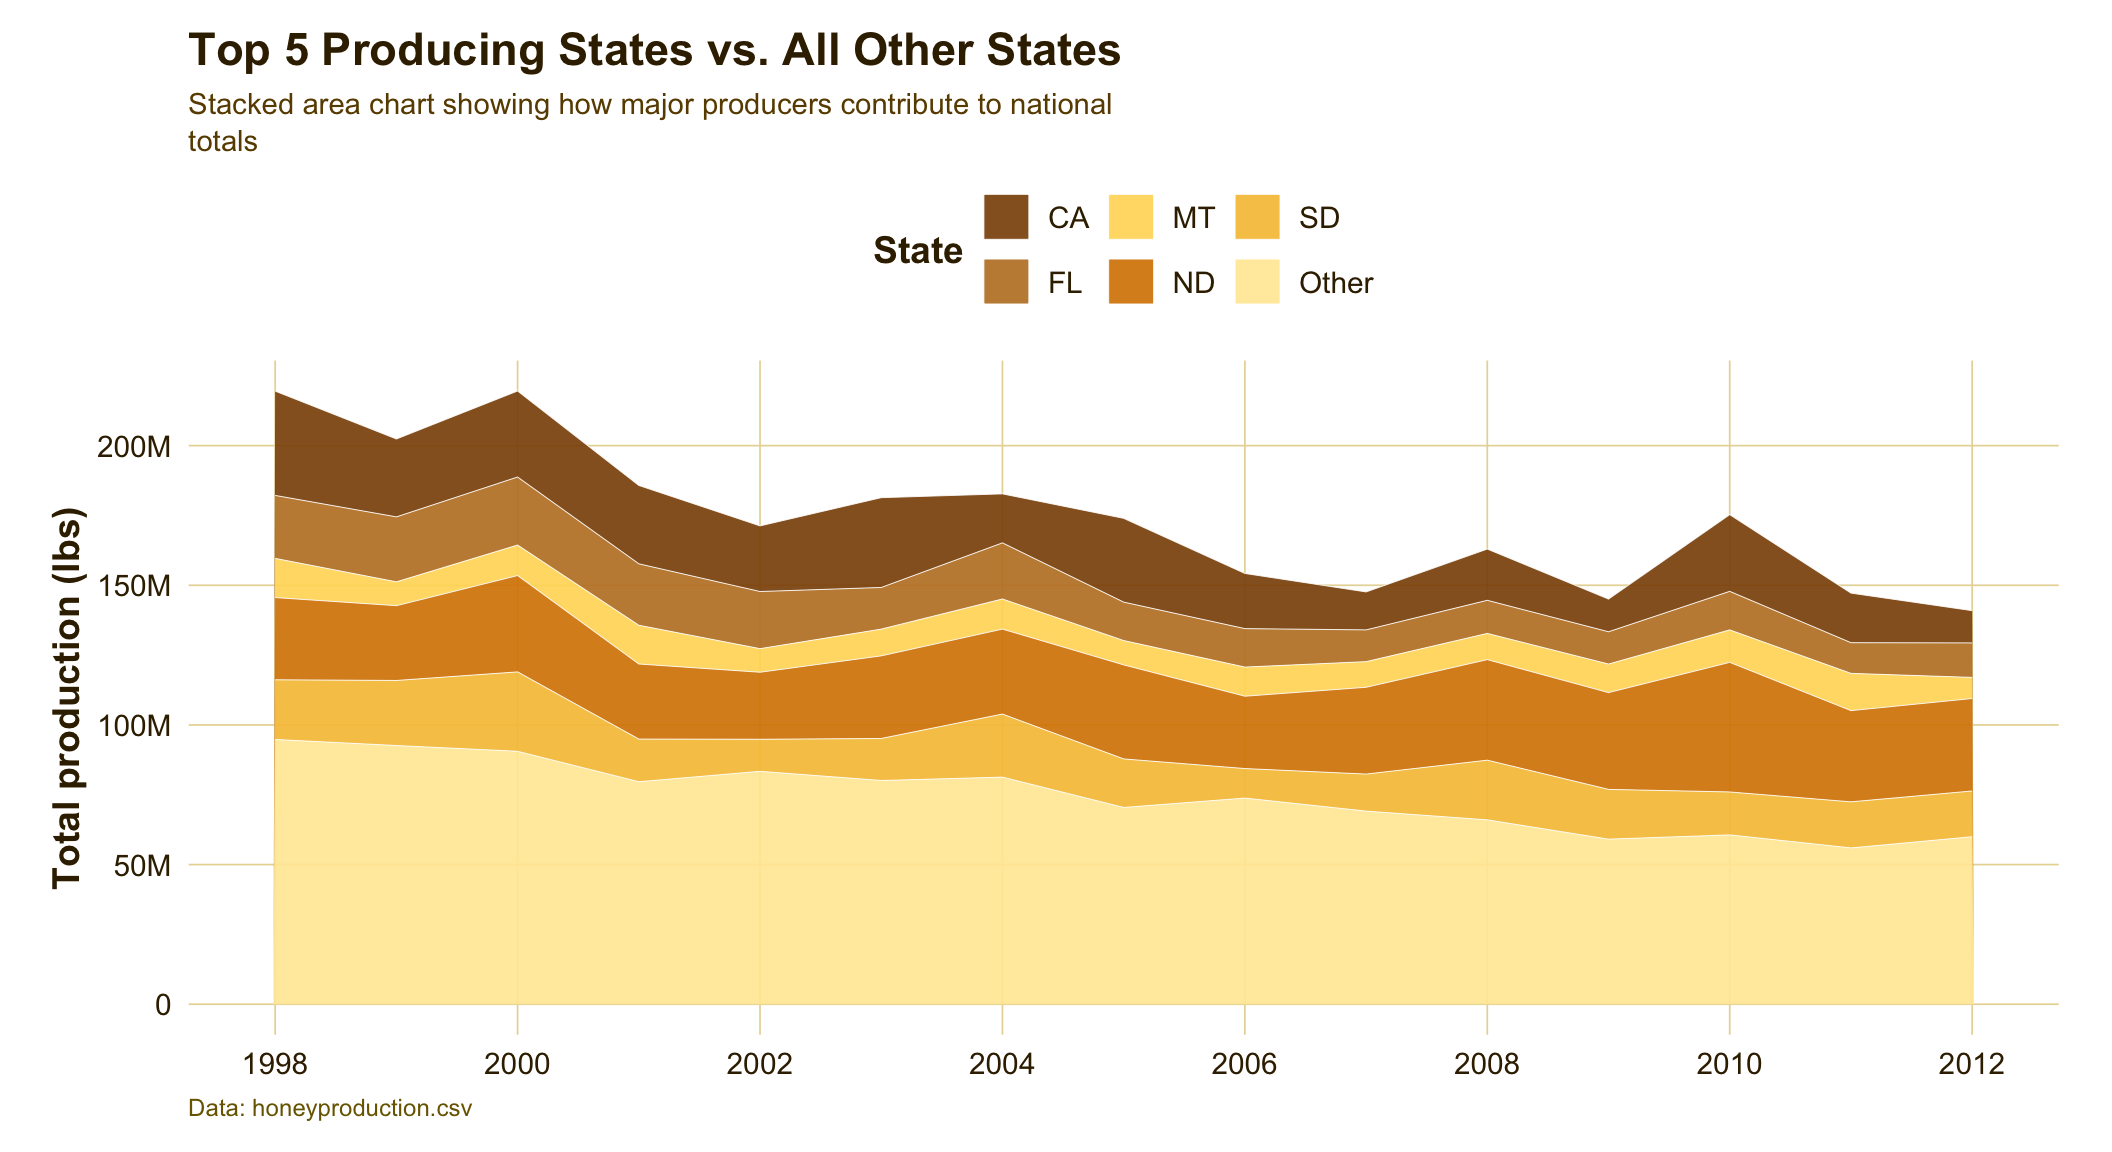
This dashboard visualizes trends in U.S. honey production from 1998 to 2012. The plots focus on geographic production patterns, national production change, state-level declines, price relationships, and the importance of top-producing states.